ドキュメントとチャートの位置
OOo のチャートはひとつのドキュメントですが、いまのところ独立したドキュメントとして編集できません。いつも埋め込み型ドキュメントとして OLE 図形描写オブジェクトに埋め込まれています。
チャートに図形描写オブジェクトからアクセスする場合には図形描写オブジェクトの種類が com.sun.star.drawing.OLE2Shape でそのプロパティ CLSID: 12DCAE26-281F-416F-a234-c3086127382e を確認します。
チャートが埋め込まれているドキュメントからチャートドキュメントオブジェクトにアクセスするには次のような経路を通ることになります。
まず、表計算ドキュメント以外では次のようになります。
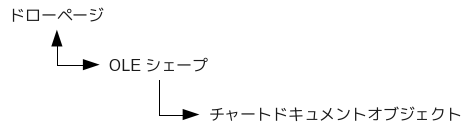
Sub AccessToChartDocument
  oDrawPage = ThisComponent.getDrawPage()
  For i = 0 To oDrawPage.getCount() - 1 step 1
    oShape = oDrawPage.getByIndex(i)
    If oShape.supportsService("com.sun.star.drawing.OLE2Shape") Then
       If oShape.CLSID = "12DCAE26-281F-416F-a234-c3086127382e" Then
         oChart = oShape.Model
       End If
    End If
  Next
End Sub
表計算ドキュメントではチャートコンテナオブジェクトもあります。
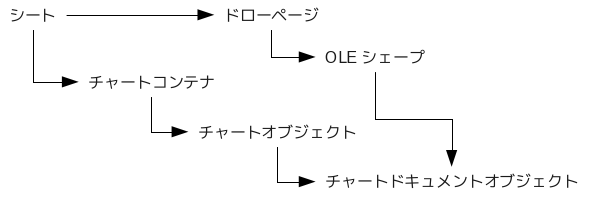
Sub AccessToChart
  oSheet = ThisComponent.getSheets().getByIndex(0)
  oCharts = oSheet.getCharts()
  For i = 0 To oCharts.getCount() - 1 step 1
    oChartObj = oCharts.getByIndex(i)
    oChart = oChartObj.getEmbeddedObject()
  Next
End Sub
ドキュメント上でのチャートのサイズを変更するとき、チャートドキュメントオブジェクトから直接変更できません。この場合にはそのチャートが埋め込まれている図形描写オブジェクトのサイズを変更しなければいけません。次のようにして同じチャートドキュメントオブジェクトを持つ図形描写オブジェクトを探し出します。
Sub FindShape
  oSheet = ThisComponent.getSheets().getByIndex(0)
  oDrawPage = oSheet.getDrawPage()
  oChartObj = oSheet.getCharts().getByIndex(0)
  oChart = oChartObj.getEmbeddedObject()

  oChartShape = FindChartShape(oDrawPage, oChart)
  If NOT IsNull(oChartShape) Then
    msgbox "Chart shape found."
  End If
End Sub


Function FindChartShape( oContainer As Object, oModel As Object )
  Dim oFound As Object, oShape As Object
  For i = 0 To oContainer.getCount() - 1 step 1
    oShape = oContainer.getByIndex(i)
    If oShape.supportsService("com.sun.star.drawing.ShapeCollection") Then
      oFound = FindChartShape(oShape, oModel)
      If NOT IsNull(oFound) Then Exit For
    Elseif oShape.supportsService("com.sun.star.drawing.OLE2Shape") Then
      If oShape.CLSID = "12DCAE26-281F-416F-a234-c3086127382e" Then
        If EqualUnoObjects(oShape.Model, oModel) Then
          oFound = oShape
          Exit For
        End If
      End If
    End If
  Next

  FindChartShape = oFound
End Function
チャートの挿入
長々とオブジェクトの説明が続く前に、チャートを挿入する方法を簡単に見ておきます。
Sub InsertChart
  oDoc = ThisComponent
  ' チャートコンテナ
  oCharts = oDoc.getSheets().getByIndex(0).getCharts()

  Dim aRange(1) As New com.sun.star.table.CellRangeAddress
  Dim aRectangle As New com.sun.star.awt.Rectangle
  ' チャート名およびチャートのサイズ
  sChartName = "Chart2"
  aRectangle = make_Rectangle(1300, 1300, 7000, 5000)

  If oCharts.hasByName(sChartName) Then
    oCharts.removeByName(sChartName)
  End If

  ' チャートを挿入
  oCharts.addNewByName(sChartName, aRectangle, aRange, False, False)
  ' 挿入したチャートオブジェクトを取得
  oChart = oCharts.getByName(sChartName).getEmbeddedObject()

  ' chart2 モジュールのダイアグラムオブジェクト
  oDiagram = oChart.getFirstDiagram()

  ' テンプレートオブジェクトを作成
  oChartTypeManager = oChart.getChartTypeManager()
  oChartTypeTemplate = oChartTypeManager.createInstance( _
        "com.sun.star.chart2.template.ThreeDPie")
  oChartTypeTemplate.changeDiagram(oDiagram)

  ' データプロバイダ
  oDataProvider = oChart.getDataProvider()

  ' 座標系を取得
  oCoords = oDiagram.getCoordinateSystems()
  oCoord = oCoords(0)

  ' チャートタイプを取得
  oChartTypes = oCoord.getChartTypes()
  oChartType = oChartTypes(0)

  ' 新しくデータソースをセルの範囲から生成
  ' css.chart2.data.TabularDataProviderArguments
  Dim aProps(3) As New com.sun.star.beans.PropertyValue
  aProps(0).Name = "CellRangeRepresentation"
  aProps(0).Value = "Sheet1.A1:B3"
  aProps(1).Name = "DataRowSource"
  aProps(1).Value = com.sun.star.chart.ChartDataRowSource.COLUMNS
  aProps(2).Name = "FirstCellAsLabel"
  aProps(2).Value = False
  aProps(3).Name = "HasCategories"
  aProps(3).Value = True

  oDataSource = oDataProvider.createDataSource(aProps)

  ' ダイアグラムにデータを設定、テンプレートでチャートのタイプも更新
  Dim aArgs(0) As New com.sun.star.beans.PropertyValue
  aArgs(0).Name = "HasCategories"
  aArgs(0).Value = True

  oChartTypeTemplate.changeDiagramData(oDiagram, oDataSource, aArgs)
End Sub


Function make_Rectangle( _
    nX As Long, nY As Long, _
    nWidth As Long, nHeight As Long ) _
        As com.sun.star.awt.Rectangle
  Dim aRectangle As New com.sun.star.awt.Rectangle
  With aRectangle
    .X = nX
    .Y = nY
    .Width = nWidth
    .Height = nHeight
  End With
  make_Rectangle = aRectangle
End Function